Insulin dashboard
A self-hosted insulin and glucose dashboard for managing type 1 diabetes.
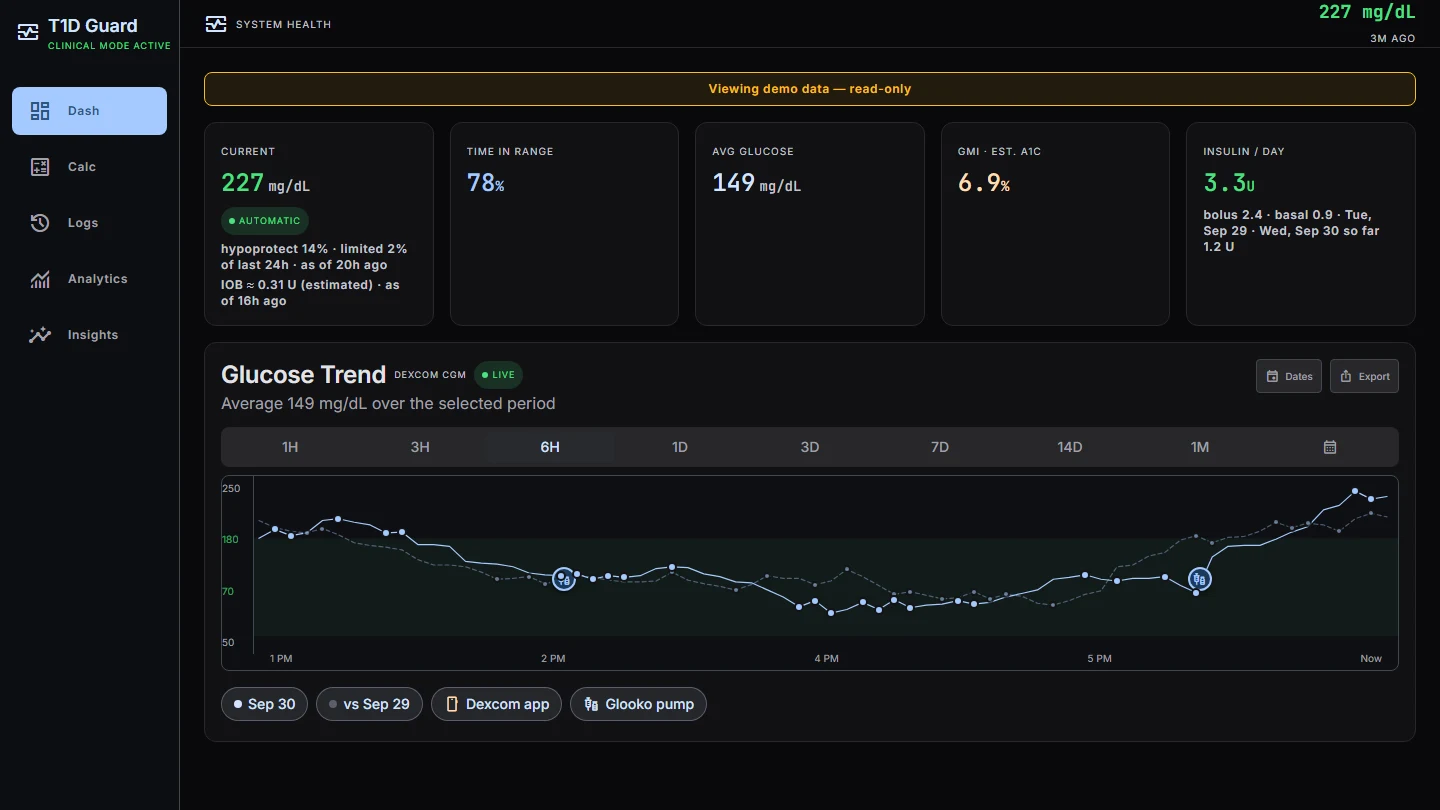
01 / problem
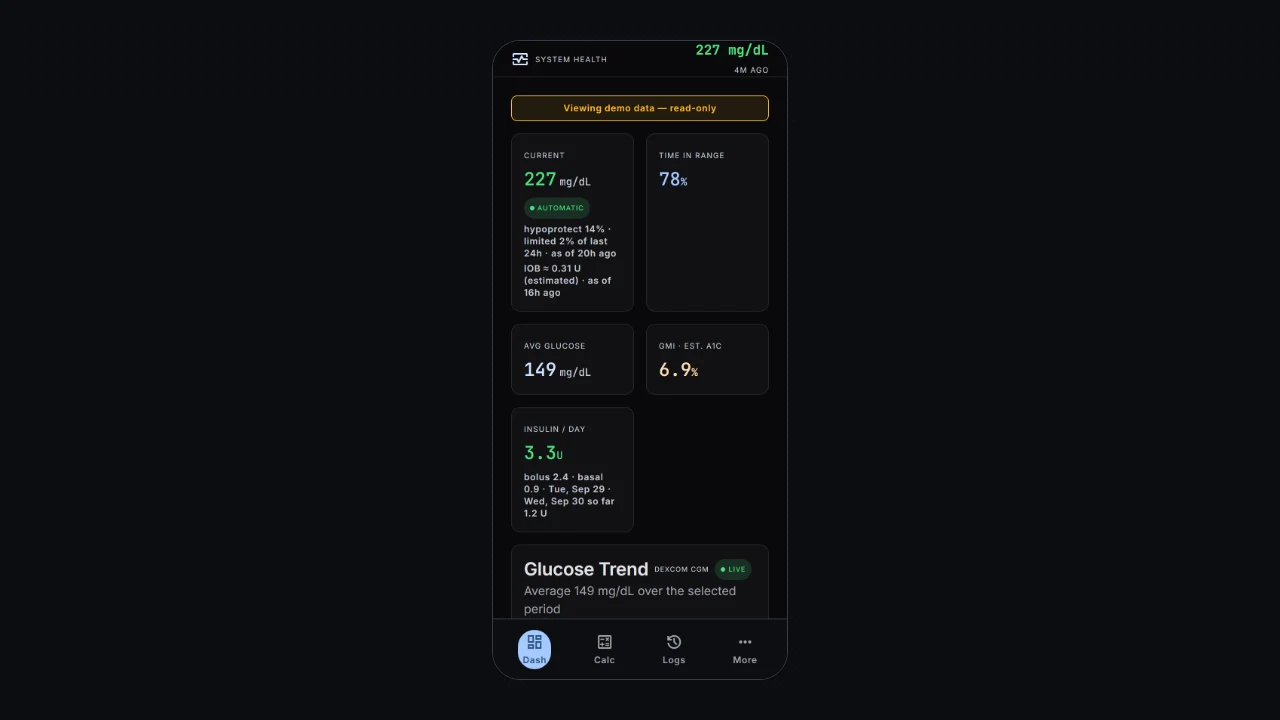
Managing type 1 diabetes meant juggling Dexcom, Glooko, and Nightscout in separate apps, none of which showed dose math next to the trend.
02 / approach
One Python API on Postgres ingests Dexcom CGM readings every minute and Glooko pump data, deduplicates across writers, and serves a single dashboard, a Garmin widget, and three LED clocks.
03 / result
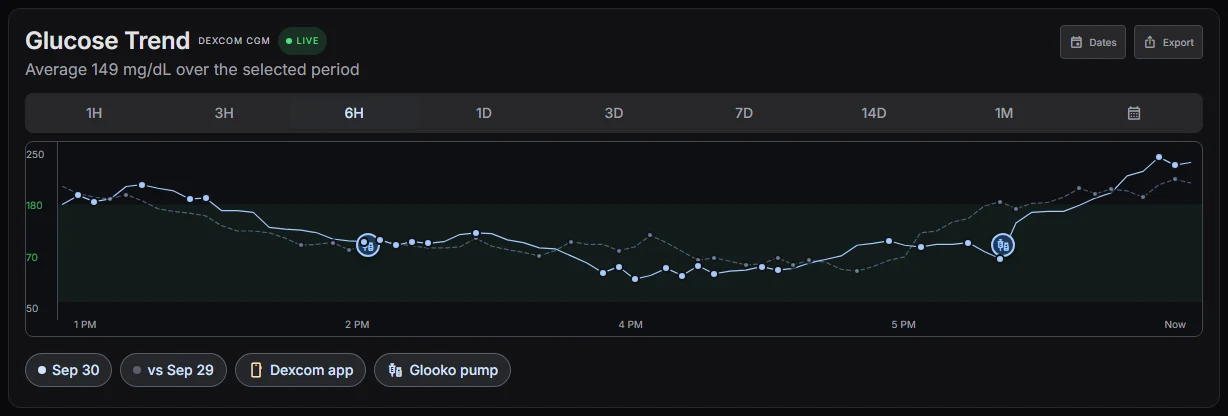
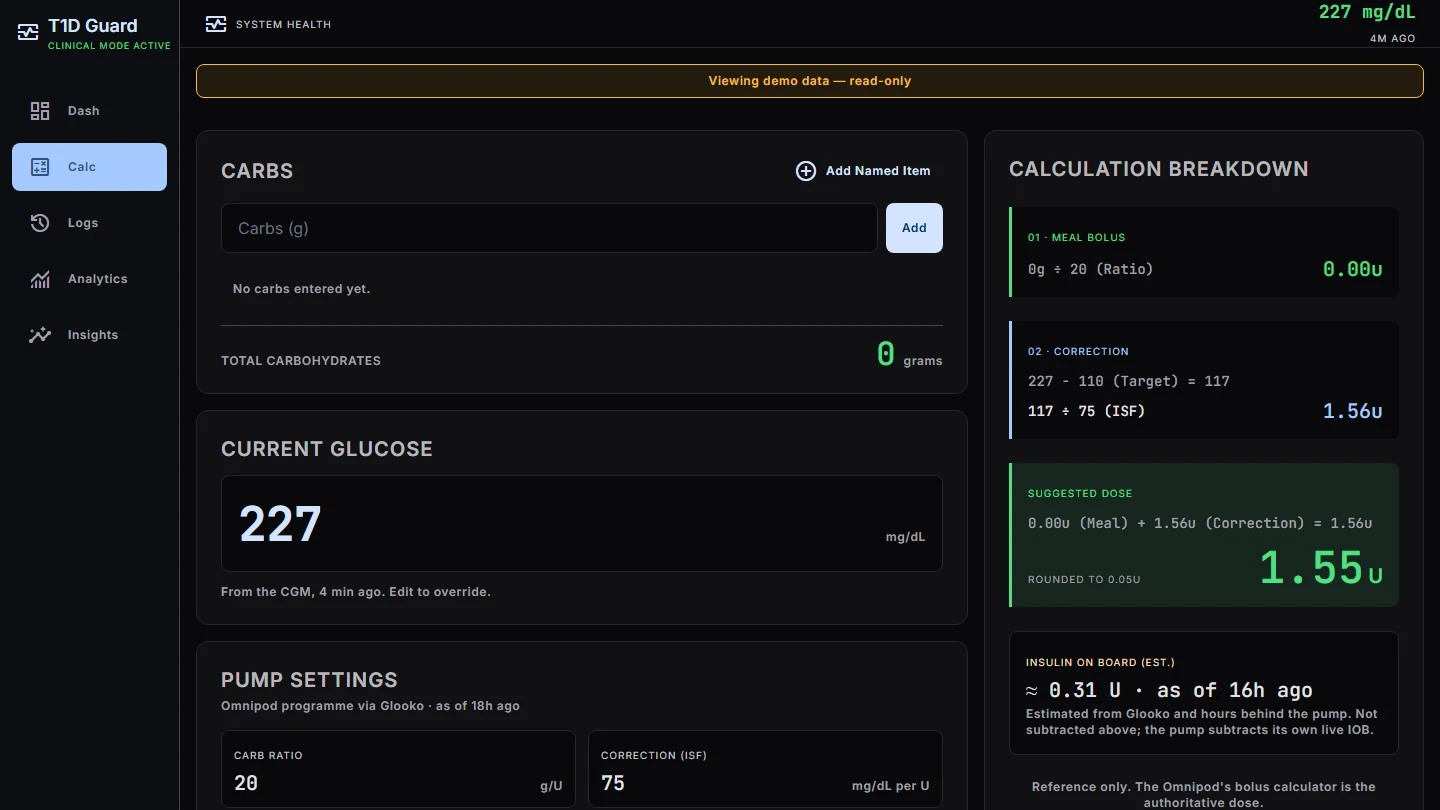
One screen with trend charts at multiple zooms, dose calculation with correction targets, insulin on board, and daily totals, running every day since launch, hardened with CSRF guards, audit logging, and a pytest regression suite.
architecture
Dexcom and Glooko → API → Postgres → dashboard, watch, clocks
Dexcom APICGM readings every minute
Glookopump doses, basal states, automation modes
Python APIingest, dedup across writers, nightly backfill, dose math
Postgresreadings, doses, audit log
Dashboardtrend charts, dose calculator, insights
Garmin watchConnect IQ glance and widget
LED clocksthree clocks on the LAN
- Sep 15 Estimated insulin on board shown under the current reading
- Aug 29 Old v1 and v2 screens retired, the Stitch design is the only UI
- Aug 22 Glooko pump data live: doses, basal states, automation modes
- Aug 1 Dedup across writers on glucose readings (re-run Aug 6)
- Jul 31 Public demo mode on synthetic data
- Jul 24 pytest regression suite, phase 1
- Jul 19 Redesigned in Stitch (v3)
- Jul 15 Security pass: login throttle, session revocation, headers, least-privilege DB role
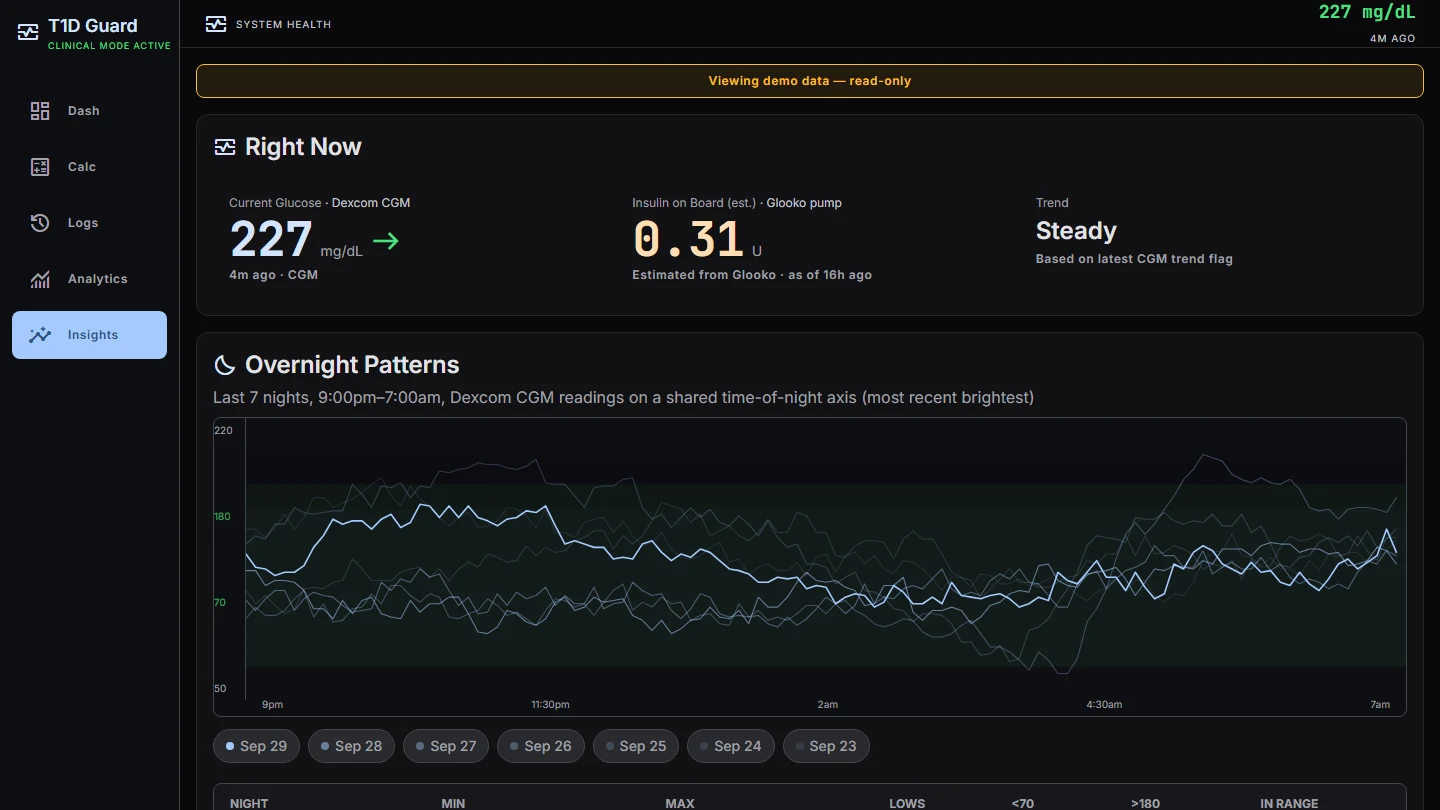
- Jul 14 Insights view replaces the Nightscout iframe
- Jul 13 Dexcom production API connected
- Jul 10 Dose calculator with correction targets
- Jul 6 First deploy
I'd build the dedup before adding a second writer, not after. Duplicate readings showed up in July, I cleaned them out on Aug 1, and they were back by Aug 6. I'd also start the test suite on day one. It landed 18 days after the first deploy, after the security pass instead of before it.